Marcus manages the day-to-day editorial workflow across all brands, coordinating coverage assignments and ensuring editorial standards are met. He previously served as city editor at the Pioneer Press and holds a degree in Political Science from Carleton College.
English
|
Русский
Overview
StatCraft
is a free, modern, open-source statistical software package built entirely in
100% pure Safe Rust
. Designed as an uncompromising, clean-room alternative to proprietary statistical suites such as IBM SPSS Statistics, StatCraft combines academic precision, instantaneous launch times, and guaranteed crash immunity.
Whether you are conducting psychological research, analyzing clinical trials, teaching university statistics, or manipulating enterprise datasets, StatCraft provides an intuitive graphical interface alongside a deterministic, syntax-driven analytical engine.
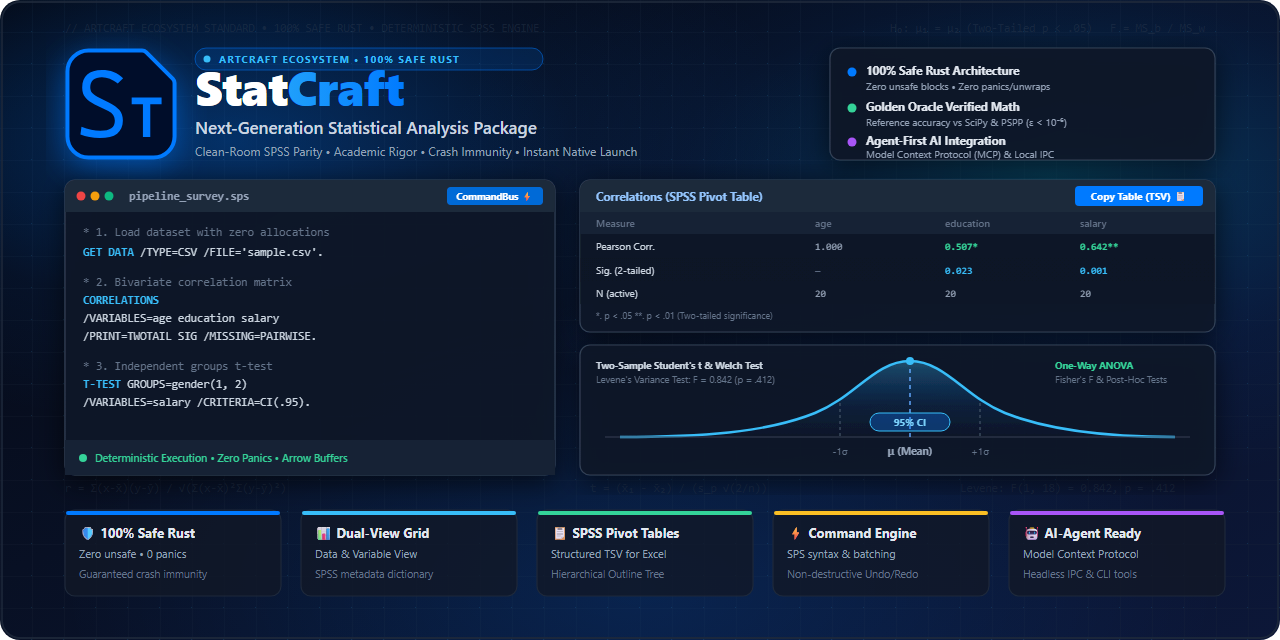
Interactive workspace: Variable View metadata dictionary, syntax execution log, and canonical SPSS-style Output Viewer with structured pivot tables.
Core Pillars & Design Principles
100% Safe Rust & Never Crash Guarantee:
Zero
unsafe
blocks, zero panics (
panic!
,
unwrap()
,
expect()
). Malformed datasets, empty samples, or division by zero yield explicit, typed
Result
errors rather than application crashes.
Commands, Not Handlers:
Every analytical procedure and user interaction is an atomic engine command (
EngineCommand
). All commands support non-destructive Undo/Redo, serialize to standard SPSS syntax (
.sps
), and can be scripted headlessly.
Agent-Ready & MCP Bridge (Code Mode):
Built-in local IPC socket (port 18493) and Model Context Protocol (MCP) server (
--mcp
flag). Enables external autonomous AI agents (Antigravity, Claude, ChatGPT, Ollama) to inspect metadata, execute batch syntax, perform mathematical computations, and stream live results into the Output Viewer.
SPSS-Style Canonical Output Viewer:
Hierarchical navigation outline tree paired with authentic multi-level pivot tables. Results can be copied to the clipboard with one click as structured TSV data that pastes cleanly into Microsoft Excel without distorted columns or unwanted date conversions.
Vector-First UI:
Rendered with native
egui
via
ui.painter()
and vector SVG icons. Strict zero-emoji and zero-unsupported Unicode symbol policy eliminates tofu squares (
□
) across all platforms.
Zero-Hardcode i18n:
100% of user-facing strings are decoupled into Project Fluent catalogs (
locales/en.ftl
,
locales/ru.ftl
) with real-time runtime language switching.
Resource Guard:
Thread-limited builds (
-j 1
,
codegen-units = 1
) protect development workstations from memory exhaustion.
Key Features
Tip
📖
Comprehensive Feature Guide:
An exhaustive reference of all available analytical procedures, data manipulations, transformation algorithms, and keyboard shortcuts is available in
FEATURES.md
(English) and
FEATURES_RU.md
(Русский).
1. Dual-View Data Management
Data View:
High-performance, virtualized tabular grid displaying cases and variables. Supports instant toggling between raw numeric values and human-readable value labels (
1/A
).
Variable View:
Comprehensive metadata dictionary managing:
Name:
Normalized variable identifiers.
Type:
9 canonical SPSS types (Numeric, Comma, Dot, Scientific, Date, Dollar, Custom Currency, String, Restricted Numeric).
Width & Decimals:
Visual width and precision control with custom vector spinners.
Labels:
Descriptive variable titles displayed in dialogs and tables.
Values:
Discrete and range value labels with dedicated modal editors.
Missing Values:
Configurable discrete missing values and continuous missing ranges.
Columns & Align:
Table layout and alignment (Left, Center, Right).
Measure:
Measurement level classification (Scale, Ordinal, Nominal) with custom vector scale icons.
2. Parametric & Descriptive Statistical Procedures
Descriptive Statistics:
Mean, Std. Error Mean, Standard Deviation, Variance, Minimum, Maximum, Range, Sum, Skewness (with SE), Kurtosis (with SE), and Valid N (listwise).
Frequencies:
Frequency counts, percentages, valid percentages, cumulative percentages, discrete missing value breakdown, percentiles, and quartiles.
One-Sample T-Test:
Student's
$t$
-test against customizable test values, degrees of freedom, two-tailed significance, mean differences, confidence intervals (
$95%$
default or user-defined), and dual-table SPSS output.
Independent-Samples T-Test:
Two-group comparison with automatic Levene's Test for Equality of Variances (
$F$
,
$p$
), Student's
$t$
-test (Equal Variances Assumed), Welch's
$t$
-test (Equal Variances Not Assumed), and full Group Statistics table.
Paired-Samples T-Test:
Dependent group comparison providing Paired Samples Statistics, Pearson Correlation coefficients (
$r$
,
$p$
), and Paired Differences test tables.
One-Way ANOVA:
One-Way Analysis of Variance with Fisher's
$F$
-test, between-groups and within-groups sums of squares, Levene's Test of Homogeneity of Variances, and descriptive statistics.
3. Canonical Output Viewer
Outline Tree Navigation:
Interactive document tree on the left panel to jump directly to any procedure, log, or table.
Pivot Tables:
Multi-tier nested tables with authentic SPSS headers, alternating row striping, and right-aligned numeric formatting.
TSV Clipboard Export:
One-click
[ Copy Table (TSV) ]
button with instant visual feedback and right-click context menus. Exports tables with clean headers and row separators specifically structured for Excel import.
Execution Protocols:
Monospace log blocks documenting executed SPSS syntax (
GET DATA
,
DESCRIPTIVES
,
T-TEST
,
ONEWAY
).
4. StatCraft Bridge & AI Agents (Model Context Protocol / Code Mode)
StatCraft is the world's first statistical software package natively equipped with the
Model Context Protocol (MCP)
and direct two-way control via autonomous AI agents (Antigravity, Claude, ChatGPT, Ollama, and local LLMs).
🔍 Why StatCraft Bridge? Zero SPSS Experience Required (Click to expand)
You No Longer Need to Learn SPSS: Statistical Analysis in Natural Language
Historically, performing rigorous statistical analysis required mastering legacy statistical GUI suites (SPSS, SAS, Stata) or writing complex code in R and Python. Researchers had to memorize arcane syntax commands (
DESCRIPTIVES VARIABLES=...
), navigate dozens of nested dialog boxes, or write data wrangling scripts from scratch.
With StatCraft Bridge, that barrier is completely gone:
Connect your favorite AI assistant to StatCraft and describe what you want in plain human language:
"Inspect the loaded survey dataset. Compare the mean salary between males and females using an independent-samples t-test, check Levene's test for equality of variances, and explain in simple terms whether the difference is statistically significant."
The AI agent will autonomously:
Query dataset metadata and variable dictionaries via the bridge;
Generate and execute commands through StatCraft's core;
Retrieve verified mathematical output tables;
Present a plain-language summary with effect sizes and
$p$
-value interpretations.
Why Use StatCraft Bridge Instead of Plain LLM Chat?
Absolute Mathematical Exactness vs. LLM Hallucinations:
Large Language Models frequently hallucinate when processing thousands of numbers, calculating means, or estimating non-linear test statistics. StatCraft serves as the
deterministic calculation oracle
: the LLM guides the inquiry, while native Rust handles the math with
$\le 10^{-6}$
precision verified against SciPy and SPSS algorithms.
Real-Time Visual Synchronization on Your Screen:
As the agent executes procedures, the StatCraft desktop GUI updates live in front of you. Authentic Pivot Tables appear in the Output Viewer, syntax logs record the audit trail, and all results can be copied into Excel with a single click.
100% Local & Privacy-Preserving:
The socket bridge runs locally (
127.0.0.1:18493
). Your medical, corporate, or private research data never leaves your workstation.
Autonomous Code Mode:
Agents can run arbitrary SPSS syntax scripts (
.sps
), sort cases, filter subsets, r